In the ever-evolving landscape of financial markets, where split-second decisions can be the difference between success and failure, understanding and harnessing the power of volume indicators in trading is paramount. These indicators act as the heartbeat of market movements, revealing the ebb and flow of trading sentiment. In this exploration, we delve into some of the most accurate and cost-effective volume indicators, dissecting their nuances to empower traders, be they frugal and cheap consumers or seasoned investors, with actionable insights.
1. On-Balance Volume (OBV): Decoding Market Conviction
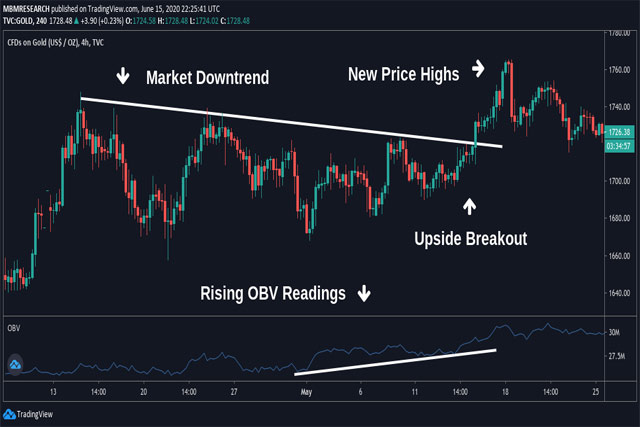
Joseph Granville’s brainchild, the On-Balance Volume (OBV) indicator, is a momentum indicator that peers into the soul of the market. By utilizing buying and selling pressure, it becomes a predictive tool for discerning price changes. Accessible on most trading platforms, OBV also provides a glimpse into crowd sentiment, a crucial aspect for spotting potential trading opportunities.
Deciphering the Smart Money
OBV’s brilliance lies in its ability to showcase the smart money entering or exiting the market. A surge in the indicator signifies institutional investors making substantial moves, while a smooth oscillation hints at retail traders following the lead of the big players. Utilizing OBV in tandem with other indicators and strategies is key, ensuring robust trend confirmation and the identification of potential reversals.
The OBV as a Trend Confirmator
In addition to predicting reversals, the OBV serves as a powerful trend confirmator. When aligned with other indicators and trading strategies, it not only aids in identifying trends but also pinpoints potential resistance and support levels. Its simplicity makes it a versatile tool easily spotted on charts, but caution is advised, as it may not be foolproof under all market conditions.
2. Volume Weighted Average Price (VWAP): A Day Trader’s North Star
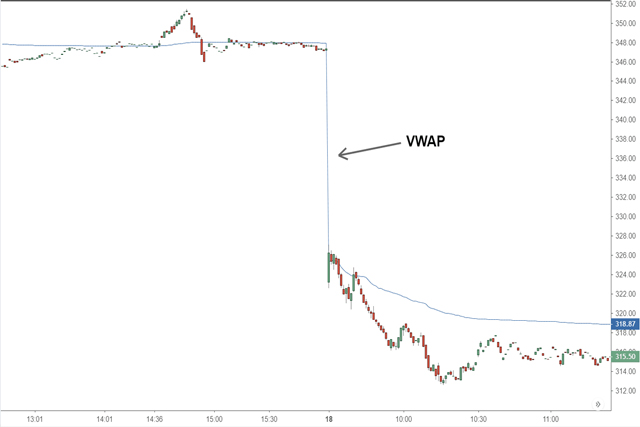
For day traders seeking precision, the Volume Weighted Average Price (VWAP) emerges as a beacon. Merging price and trading volume, VWAP offers reliability by resetting at each trading session’s onset. It provides clear signals of market direction, with prices above signaling a bullish market and prices below indicating a bearish sentiment.
The Trifecta: OBV, VWAP, and Moving Average
VWAP finds synergy with OBV and the Moving Average, creating a potent combination for trend identification. While the Moving Average introduces a temporal element to trend analysis, traders should remain vigilant about its inherent lag. The trio, when harmonized, aids in decoding the intentions of market players, facilitating timely and informed decisions.
VWAP and Intraday Trading Strategies
Intraday traders particularly find solace in VWAP. Its ability to reset daily ensures that it accurately reflects intraday price action, making it a go-to indicator for those engaging in short-term trades. Coupled with other intraday strategies, VWAP becomes a linchpin in crafting successful trading plans.
3. Money Flow Index (MFI): Dynamic Insights into Market Dynamics
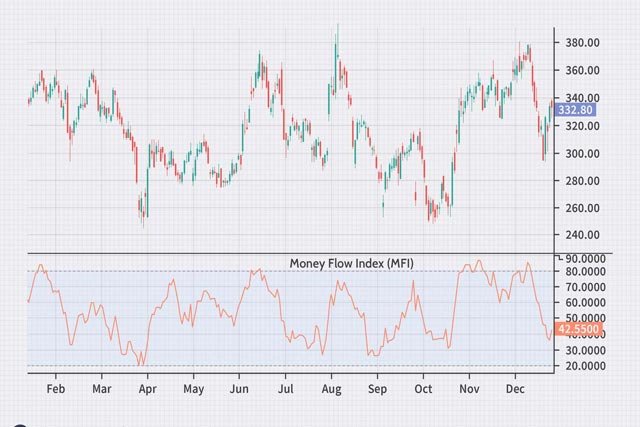
The Money Flow Index (MFI) adds dynamism to the volume indicator repertoire. By tracking raw money flow volume, it provides a comprehensive view of market trends and potential price movements. Its proficiency in spotting divergences enhances its utility in identifying trend reversals.
Deciphering Market Intentions with MFI
MFI’s unique blend of price and volume calculations renders it a powerful tool for decoding market intentions. Traders can discern whether an asset is being accumulated or distributed, crucial information for anticipating future price movements. However, vigilance is paramount, as false signals can arise, especially when relying on historical data.
MFI and Market Player Intentions
In addition to revealing trends, the MFI acts as a window into the intentions of prominent market players. Analyzing its relationship with closing prices, their range, and associated volume allows traders to determine whether an asset is being hoarded or sold off. Close observation of MFI patterns aids in making informed decisions.
4. Relative Strength Index (RSI): A Derivative Indicator with Volume Wisdom
The Relative Strength Index (RSI) takes the stage as a derivative indicator incorporating trading volume into its calculations. Designed to identify trends and predict future price action, RSI becomes a valuable ally for traders and investors alike.
RSI’s Overbought and Oversold Insights
Navigating the overbought and oversold zones is where RSI shines. A reversal is on the horizon in the overbought zone, offering traders strategic entry points. The interplay of positive and negative divergences further refines the timing of trades, enabling traders to make informed decisions.
Fine-Tuning RSI for Maximum Efficacy
Adjusting the timeframe of RSI according to trading needs and strategies enhances its efficacy. Shorter timeframes make the indicator more sensitive to price changes, generating more signals. Conversely, longer timeframes reduce sensitivity, providing fewer but potentially more reliable signals. The careful calibration of RSI to align with individual trading styles is crucial for its optimal utilization.
Conclusion: Mastering the Symphony of Volume Indicators
In the labyrinth of financial markets, where precision is the key to success, mastering the symphony of the best volume indicators becomes imperative. On-Balance Volume, Volume Weighted Average Price, Money Flow Index, and Relative Strength Index emerge as virtuoso players in this symphony. Traders equipped with the knowledge of these indicators, harmonizing them judiciously, unlock the potential for more accurate decisions and amplified profits. As you venture into the dynamic world of trading, remember that these indicators are not standalone solutions but powerful tools to be wielded in conjunction with comprehensive strategies and market analysis. In this pursuit of mastery, continuous learning and adaptability will be your most potent allies.


